









5.8 Dashboard Charts
Use Daily Population and Mortality Trend to follow changes in your animal counts. Keep the interval set to Daily for both charts. Their values are counts, even if the chart setup form also contains a Currency field.
Daily Population
- Chart Type: Custom; source: Daily Population; display: Line; Time Series enabled.
- Each point is historical daily closing animal population, including quiet days carried forward from earlier movements.
- Opening history before the displayed range is needed to establish the first day's closing balance.
- Default scope uses the user's default Company and accessible livestock-marked Batches; optional Item, Batch, and House filters narrow it.
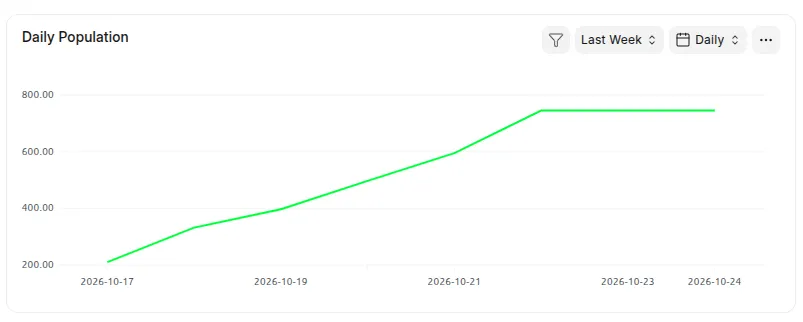 Daily Population line showing a quiet day and a subsequent verified increase.
Mortality Trend
- Chart Type: Custom; source: Mortality Trend Source; display: Line; Time Series enabled.
- Each point shows classified posted mortality quantities, not the number of Stock Entry documents and not a mortality percentage.
- Source access, stock allocations, and classification determine what is included.
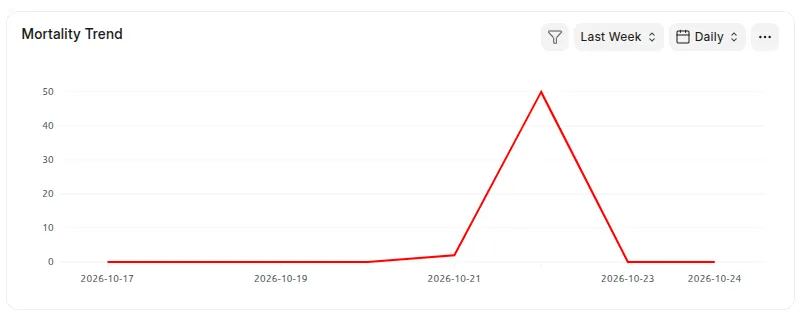 Mortality Trend showing the same known loss day with an animal-count axis.
Last updated 3 weeks ago
Was this helpful?